How to Calculate What Your Slow Kubernetes Dev Loop Is Costing You
If you develop on Kubernetes, you know the loop: change a line of code, push it, build an image, deploy it to staging, test the change, find the bug, repeat.
This loop is so familiar that it probably doesn’t even register as a cost anymore. Engineers feel it as friction, engineering leaders feel it as slow velocity, and finance sees a cloud bill, but very few teams ever connect these and put an actual number on what the loop costs them.
That’s a problem, because you can’t prioritize fixing something you’ve never measured. In this post, we’ll break down where the time in a typical Kubernetes dev loop actually goes, walk through a simple way to convert that time into money, and then look at how to replace one-off estimates with real usage data.
Where the time actually goes
When your code has fewer dependencies, the feedback loop is quick: run the tests locally and you know within seconds whether your change works. But most services running in Kubernetes don’t look like that. They talk to databases, queues, and other microservices, and verifying a change means running it against those dependencies. In most organizations, that means deploying, and deploying means:
- Waiting for CI: 10-15 minutes is typical for all the CI checks to run and the container image to get built, all before your change is anywhere it can be tested.
- Waiting for the staging environment: waiting for the rollout, and often waiting for the environment itself, since staging is usually shared and someone else’s change might be sitting on it.
- Verifying manually: sending requests, checking logs, confirming the behavior.
Add it up and a single verification cycle lands somewhere between 20 and 30 minutes. Most developers go through this loop several times a day.
Teams usually try to shorten the loop in one of two ways. Some replicate the environment locally with docker-compose or a local cluster, which works until the local setup drifts from production and starts producing its own class of bugs (plus someone has to maintain it), or the application grows too big to run locally. Others spin up ephemeral environments per branch or per developer, which solves the drift problem but replicates the entire application stack every time, and now the cost shows up on the cloud bill instead.
The back-of-the-envelope calculation
Here’s the simple version of the math. You need four inputs:
- How many verification cycles a developer goes through per day
- How many minutes each cycle takes
- The loaded cost of a developer (salary plus overhead)
- The size of your team
Let’s use deliberately conservative numbers. Say each developer does 4 cycles a day, each cycle takes 20 minutes, and the loaded cost of an engineer is $100,000 a year which is roughly $48 an hour.
- 4 cycles × 20 minutes = 80 minutes per developer per day
- 80 minutes × $48/hour ≈ $64 per developer per day
- Across ~250 working days ≈ $16,000 per developer per year
- For a team of 50 developers ≈ $800k per year
That’s nearly a million dollars a year, for a mid-sized team, using inputs most platform engineers would call optimistic. Run the same math with your own numbers; if your builds are slower, your team is bigger, or your developers iterate more often, the figure climbs quickly.
And if your team went the ephemeral environments route, there’s a second thing to consider: the infrastructure cost of duplicating your stack per branch or per developer. That one you can read directly off your cloud bill and add to this calculation.
A back-of-the-envelope calculation like this won’t give you a precise figure, and that’s fine. As we covered in our post on how to measure the ROI of developer tools, the point of this math is a preliminary check: if the numbers look bad even with conservative estimates, you have a real problem worth fixing.
The costs that don’t show up in the math
The formula above only counts the waiting, but there are other costs associated with a slow dev loop to consider as well:
- Context switching. Nobody stares at a deploy progress bar for 20 minutes. Developers switch to something else, and research shows that interruptions like these lead to more stress, higher frustration, time pressure and effort. So a 20-minute wait doesn’t cost 20 minutes, it also hurts the developer experience in your organization.
- Batching. When every verification costs half an hour, developers tend to batch their changes to reduce the wait. Bigger changes mean bigger pull requests, slower reviews, and riskier deploys.
- Skipped verification. When testing against real dependencies is expensive, some changes just don’t get tested against real dependencies. They get pushed with fingers crossed, and the bugs surface in CI or staging at which point they are more expensive to fix.
None of these fit neatly into the formula. This means whatever number you calculated above is almost certainly an undercount.
From estimates to real data
Our solution to the underlying problem of a slow Kubernetes dev loop is mirrord: instead of building and deploying to test every change, your service runs locally while mirrord connects it to your staging cluster where you’re able to test it with real traffic, real environment variables, and real dependencies. The 20–30 minute verification cycle becomes seconds, because there’s no image build, no CI run, and no deployment between you and the feedback. Moreover, multiple developers (or AI agents) can concurrently develop and test against the already existing staging cluster, which means there’s no need to provision or maintain any extra dev or test environments.
But rolling out a tool like this across an organization raises the question every engineering leader eventually asks: is it actually being used, and what are we getting back?
That’s what the mirrord Admin Dashboard is for. It’s a web interface served from the mirrord license server that gives platform teams visibility into usage across the org:
The Usage view shows total sessions, cumulative session time, and mirrord for CI sessions, with a cross-referenced table of users and the workloads they target.
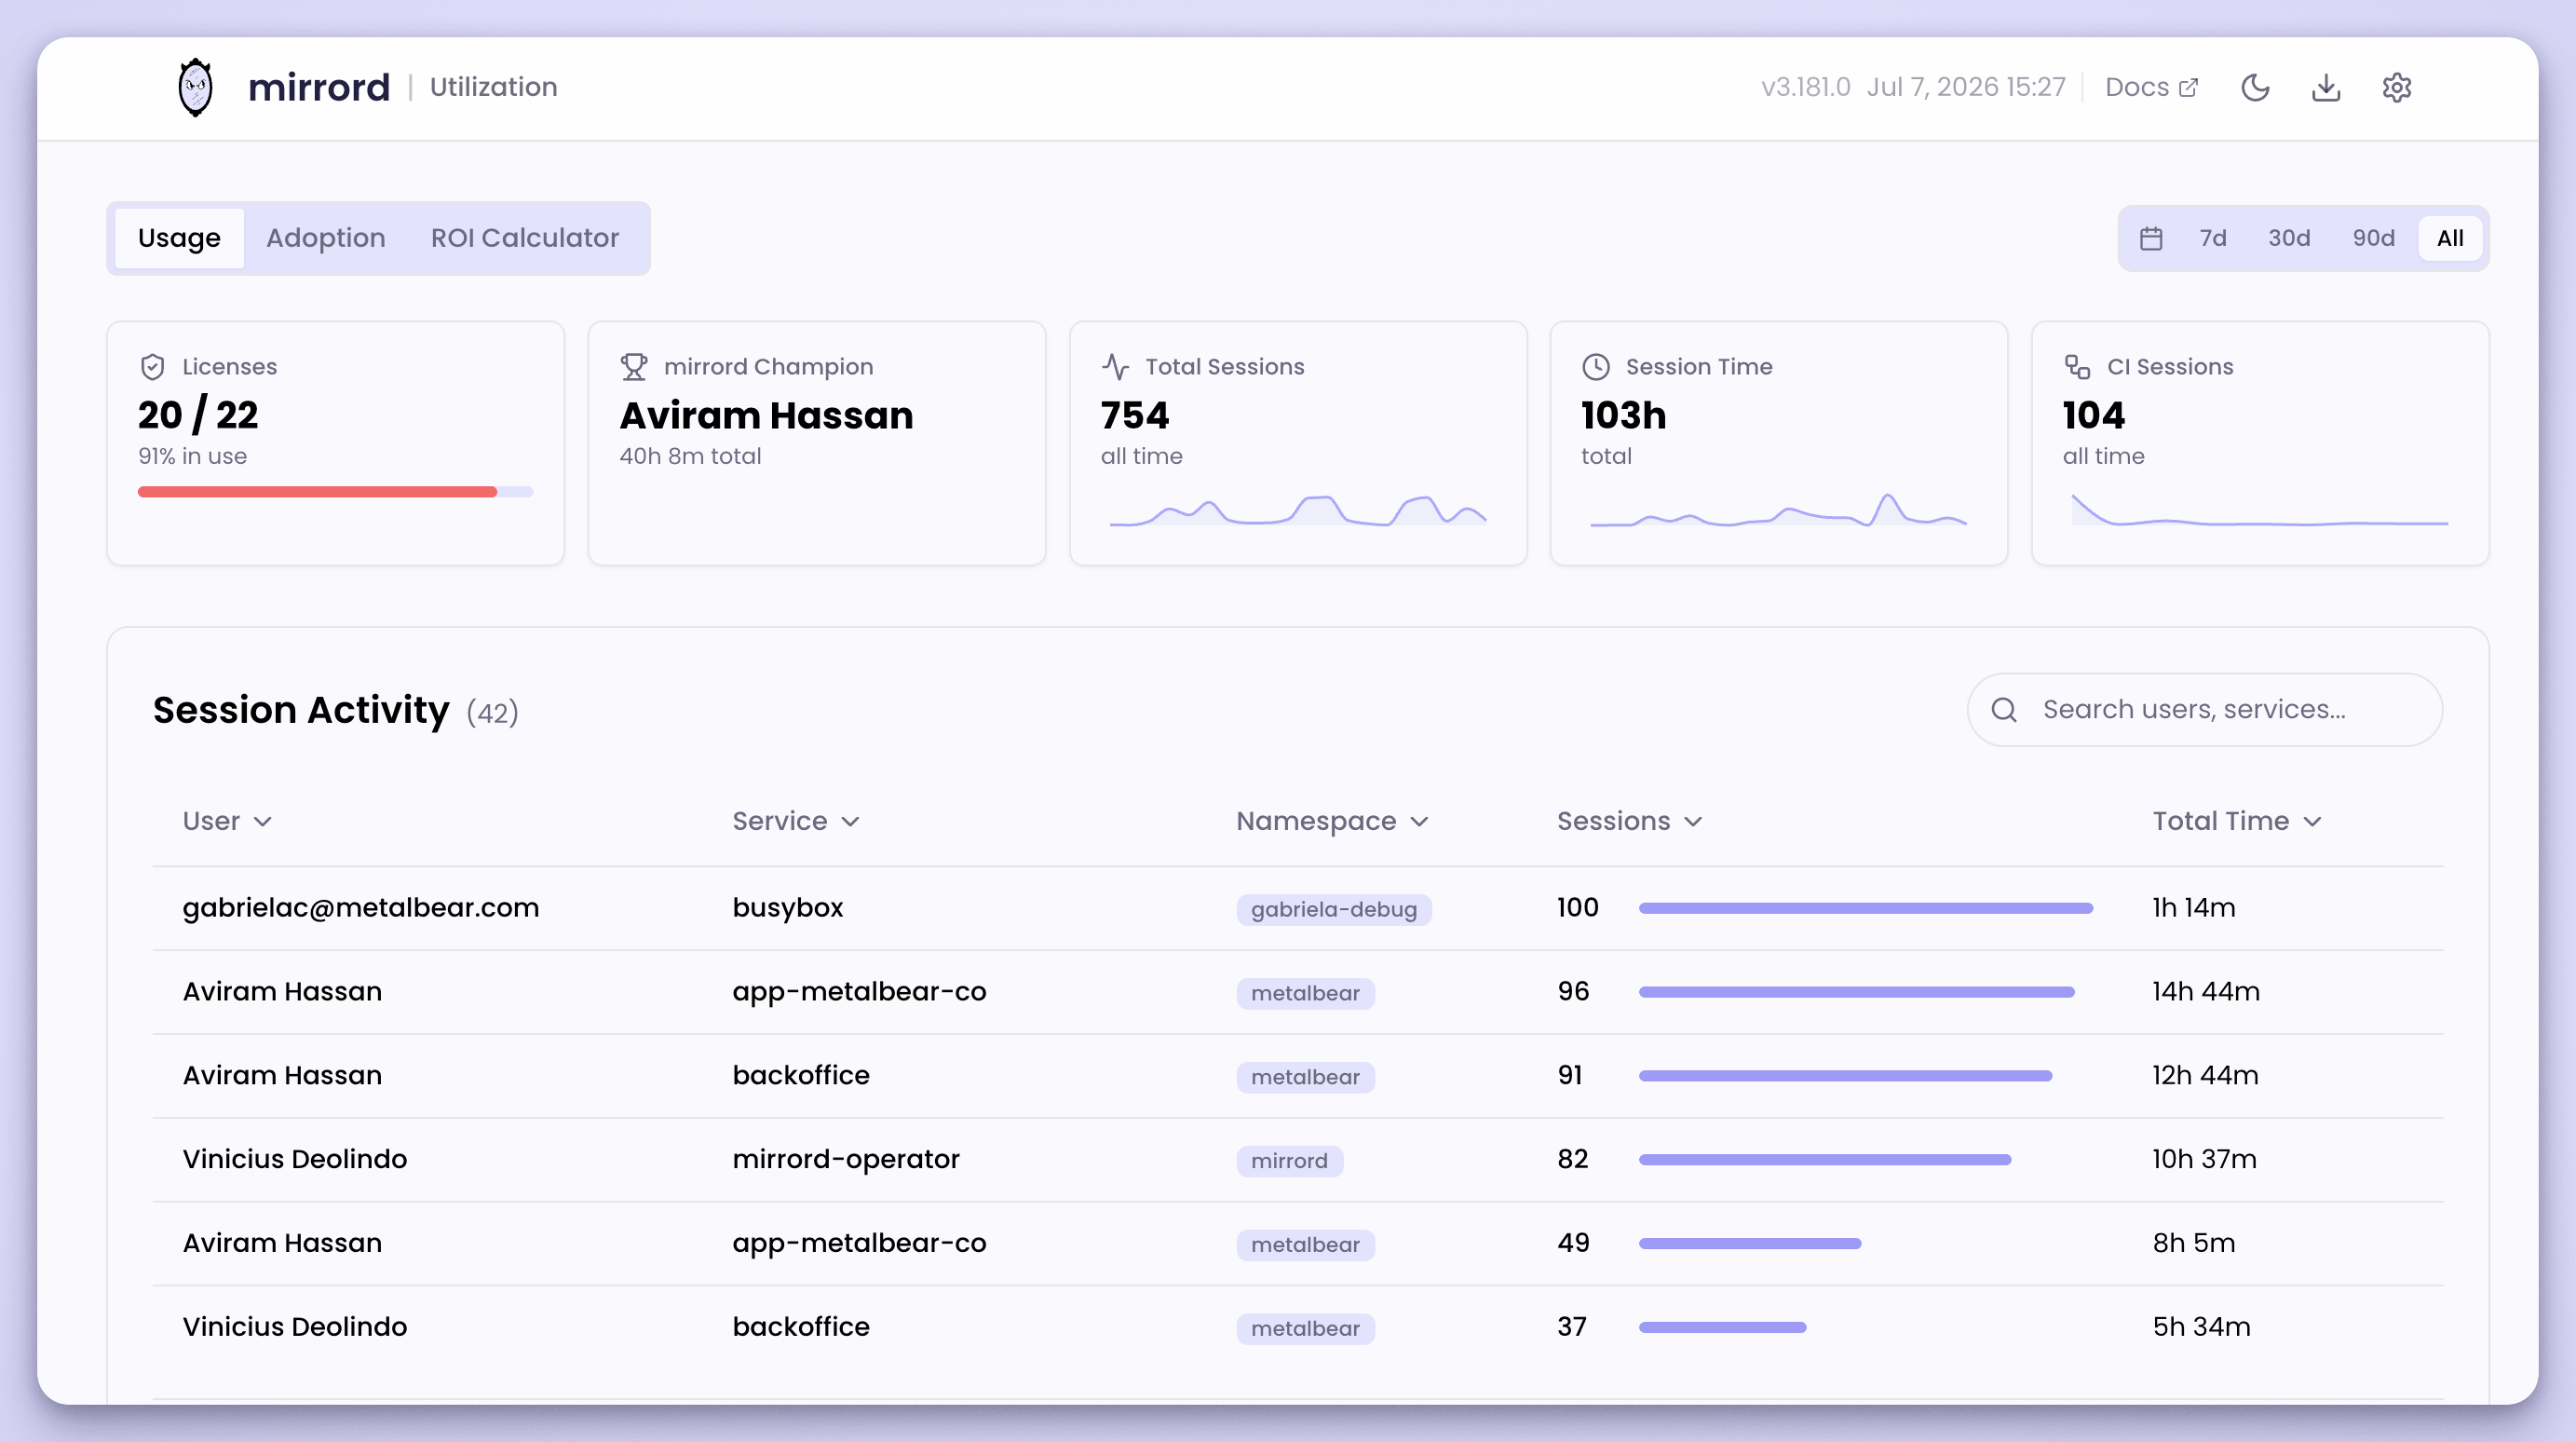
The Usage view in the mirrord Admin Dashboard
The Adoption view shows adoption over time across different teams in your organization. You can see where usage is trailing off and take recommended next steps to fix that.
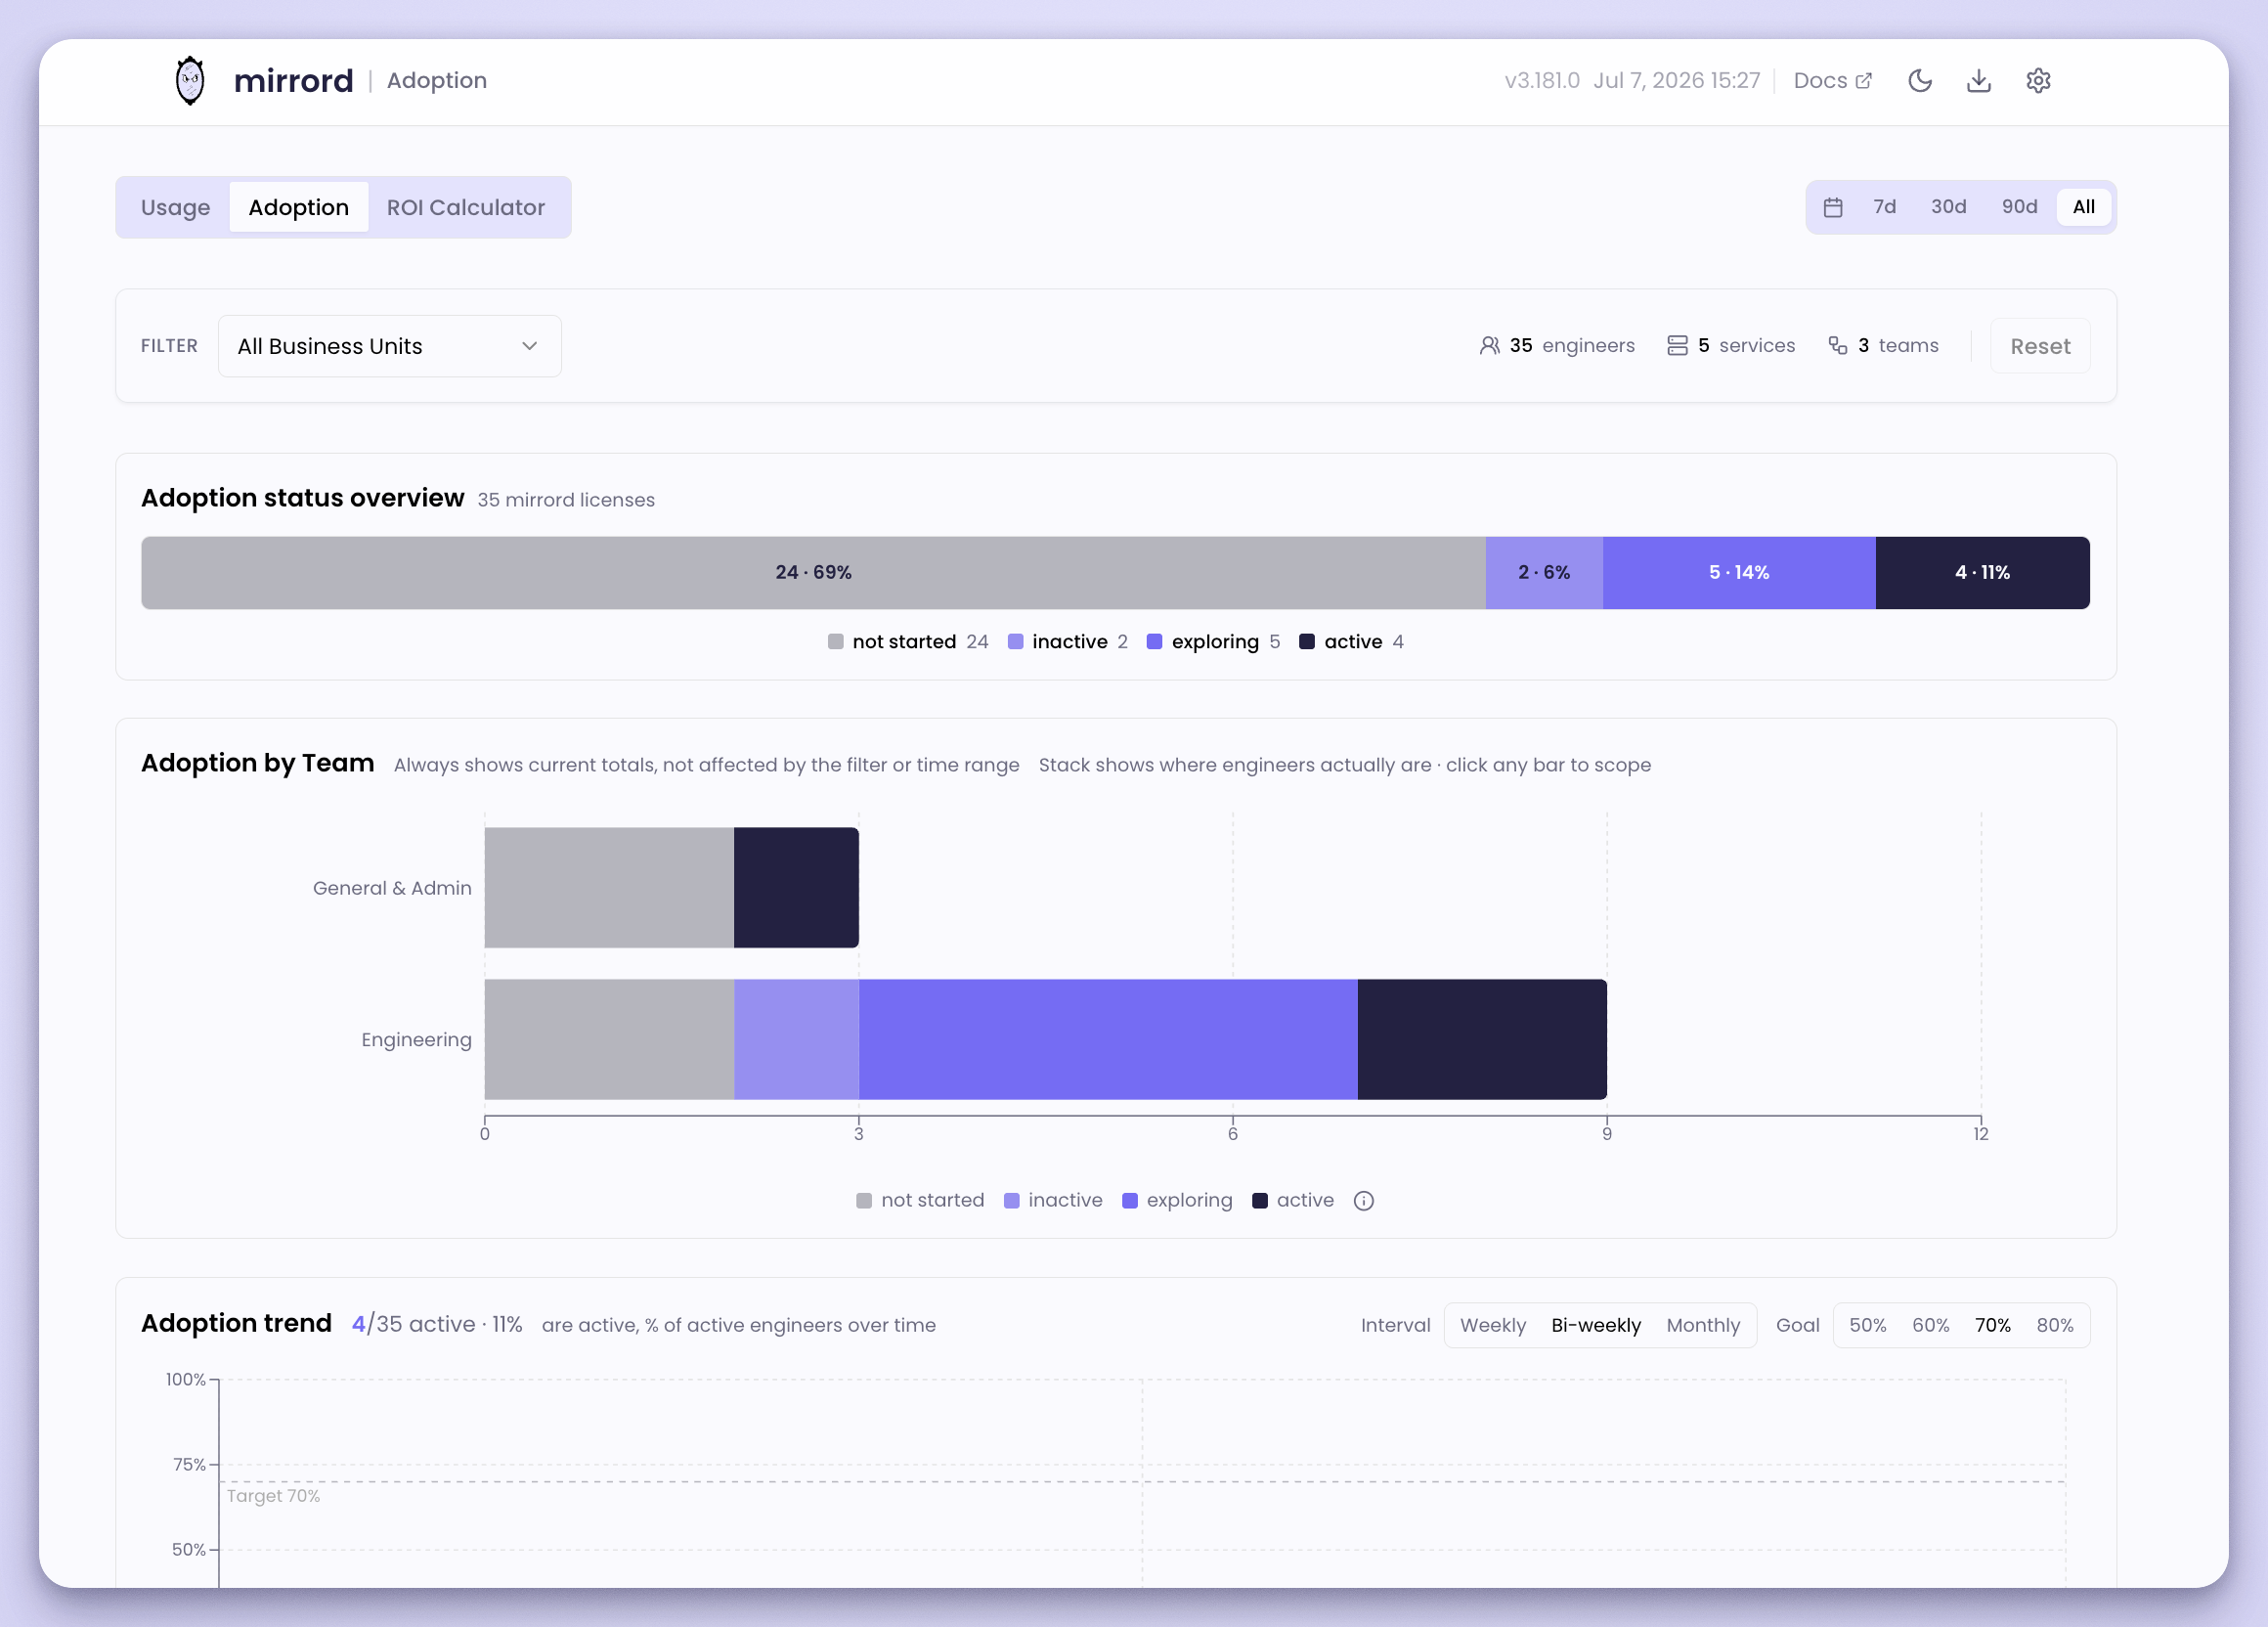
The Adoption view in the mirrord Admin Dashboard
And because the whole point is connecting usage back to cost, the dashboard includes an ROI Calculator built on the same math we walked through above.
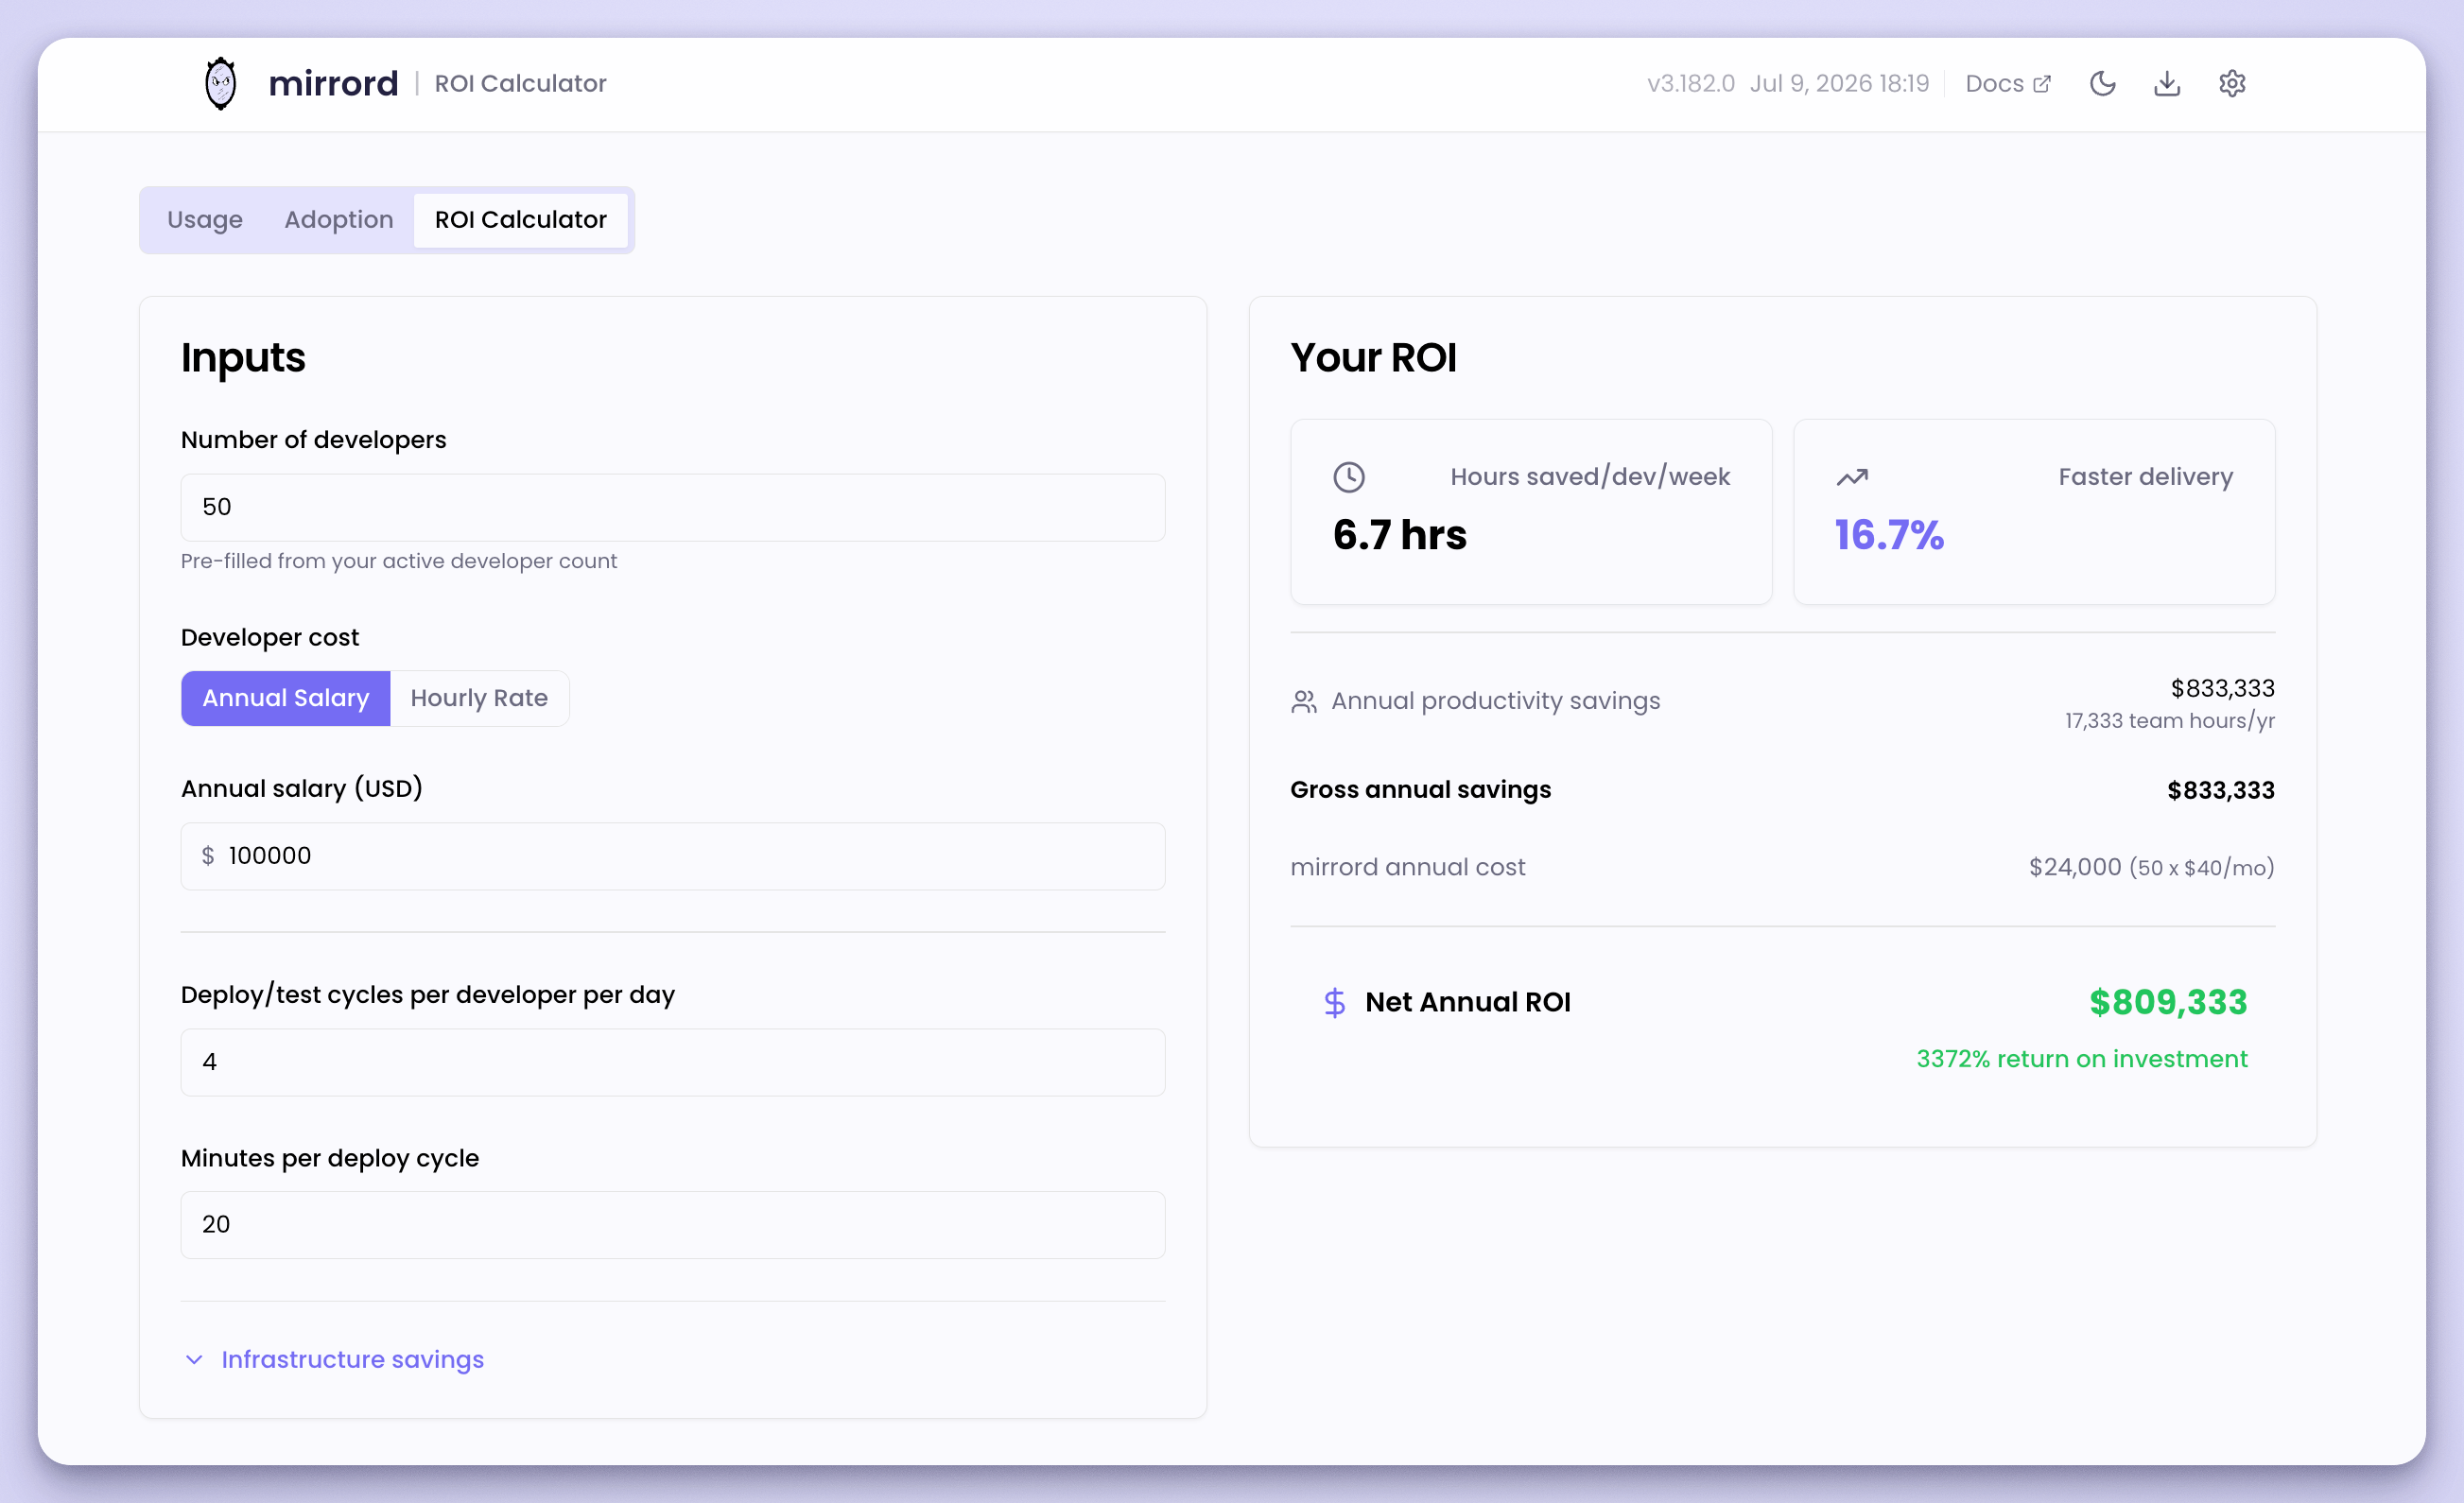
The ROI Calculator in the mirrord Admin Dashboard
Your team size is automatically filled in from the Usage section, you plug in your developer cost, cycles per day, and minutes saved per cycle, plus any staging environments you’ve been able to decommission, and it calculates hours saved per developer per week, development velocity boost, and net annual ROI after the license cost.
The difference from the back-of-the-envelope version is that the inputs now sit next to real adoption data. You’re not asserting that developers save time based on a survey from six months ago, you can see the mirrord sessions being launched, which teams they’re coming from, and whether adoption is growing or stalling.
If you want to poke around a real instance before setting anything up, we host a live playground of the dashboard. And if you’re already running mirrord with an Enterprise plan, enabling it is a single Helm value you need to set to true.
Put a number on it
A slow dev loop is one of the biggest invisible line items in an engineering budget. It hides because it’s distributed (a few minutes at a time, across every developer, every day) and because everyone has learned to treat it as the cost of doing business on Kubernetes.
But actually doing the math barely takes an afternoon: cycles per day, minutes per cycle, loaded cost, and team size. If the number that comes out is uncomfortable, the fix is simple: shortening the loop itself and then measuring that the improvement actually materialized.
If you’d like to see what that looks like in practice, check out our docs to get started with mirrord, and join our Slack community if you have questions or want help running this calculation for your own team.