Easier OpenTelemetry Instrumentation with Remocal Development
If you were at KubeCon London earlier this year you probably noticed that observability was everywhere. It’s no longer being treated as an optional “we’ll add it later” thing. Enterprises are realizing that without observability, running a modern distributed application feels like flying blind. When something fails, you need to know why, where, and how to fix it before customers start noticing.
That’s exactly why OpenTelemetry (OTel) has been blowing up. It’s an open source project that gives you a standard, vendor-neutral way to capture logs, metrics, and traces. But the process of actually instrumenting your code with OpenTelemetry is still kind of painful. To make sure the instrumentation you added works, you need to test it in the staging cluster. So you add it locally, but to test it, you need to commit your changes, push, wait for the pipeline, deploy to staging, and only then see if your spans or metrics even work or not. And when they don’t (because something always breaks the first few times), you’re stuck repeating that cycle all over again.
But what if you could skip that whole cycle and test your instrumentation the moment you write it? Instead of waiting for CI/CD pipelines or deployments, mirrord lets your instrumented app run locally while connecting directly to your cluster’s observability stack. It talks to the same OTel collectors anduses the same environment variables, secrets, and network context as if it were already in Kubernetes. When you send a request to your locally running app, mirrord routes it through the cluster so that your new spans, metrics, and logs are picked up by the OpenTelemetry collector sidecar and flow into the observability backend. This way, you can immediately see in Grafana (or whatever platform you’re using) whether your instrumentation is working.
In this guide, we’ll show you exactly how to set this up and finally ditch the painful “deploy-and-wait” loop.
Prerequisites
In order to follow along with this step-by-step tutorial, make sure you have the following set up:
- A Kubernetes cluster (I’ll be using a local cluster with k3d)
- mirrord CLI installed
- Clone the sample application we’ll be working with
Note that while I’ll be using mirrord with the CLI, you can also use the extension for code editors like Cursor, VS Code, Windsurf, and the JetBrains IDEs as well.
Setting Up the Environment
In a real-world setup, your app would already be running in a staging cluster with OpenTelemetry configured. But since this is a tutorial and we don’t all have staging clusters lying around, we’ll spin one up ourselves. We’ll use k3d to create a local Kubernetes cluster:
k3d cluster create otel-mirrord
We’ll now deploy Kubernetes manifests that set up both the app and a full observability stack. In this setup we have:
- A partially pre-instrumented Node.js app
- The OTel collector grabs all traces and metrics emitted by the app
- Winston which we use to generate structured logs that get sent to the observability backend
Our observability stack includes:
- Tempo – for distributed tracing
- Loki – for log aggregation
- Prometheus – for metrics collection
- Grafana – the place where it all comes together with dashboards and queries
Here’s a diagram to give you the full picture:
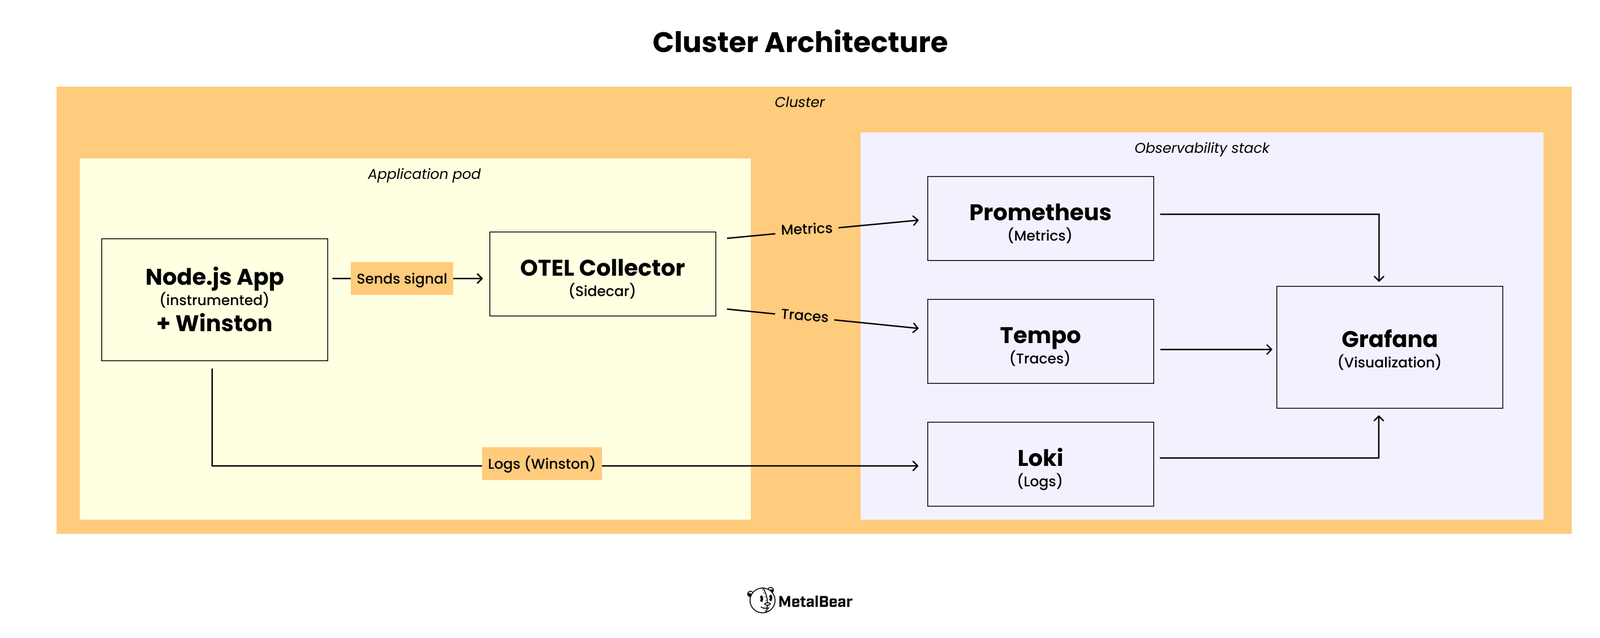
Cluster architecture for the sample app
Clone the demo repo and cd into it:
git clone https://github.com/ThatCoolGuyyy/observability-demo
cd observability-demo
Then spin up the observability stack by applying the manifests:
kubectl apply -f k8s/observability-stack/
Finally, deploy the application which has been partially instrumented:
kubectl apply -f k8s/app/
These manifests create a pod with:
- The application container
- An OpenTelemetry Collector sidecar that forwards metrics and traces
Once everything has been deployed, expose Grafana outside the cluster so that we can view our dashboards:
kubectl port-forward service/grafana 3005:3005
Note: Keep this terminal open since the port-forward needs to keep running. Open a new terminal for the next steps.
Now head over to http://localhost:3005/dashboards in your browser and log in with admin as the username and password (Grafana will ask you to set a new password after this).
After logging in, you’ll find two pre-configured dashboards already pulling in data from our deployed app:
- Metrics & Logs Dashboard – request rates, response times, logs
- Distributed Tracing Dashboard – traces flowing in from the app
Spend some time exploring these dashboards. You’ll notice that in the metrics dashboard, the Requests Per Second panel shows “No data.” That’s expected since our app is only “partially” instrumented.
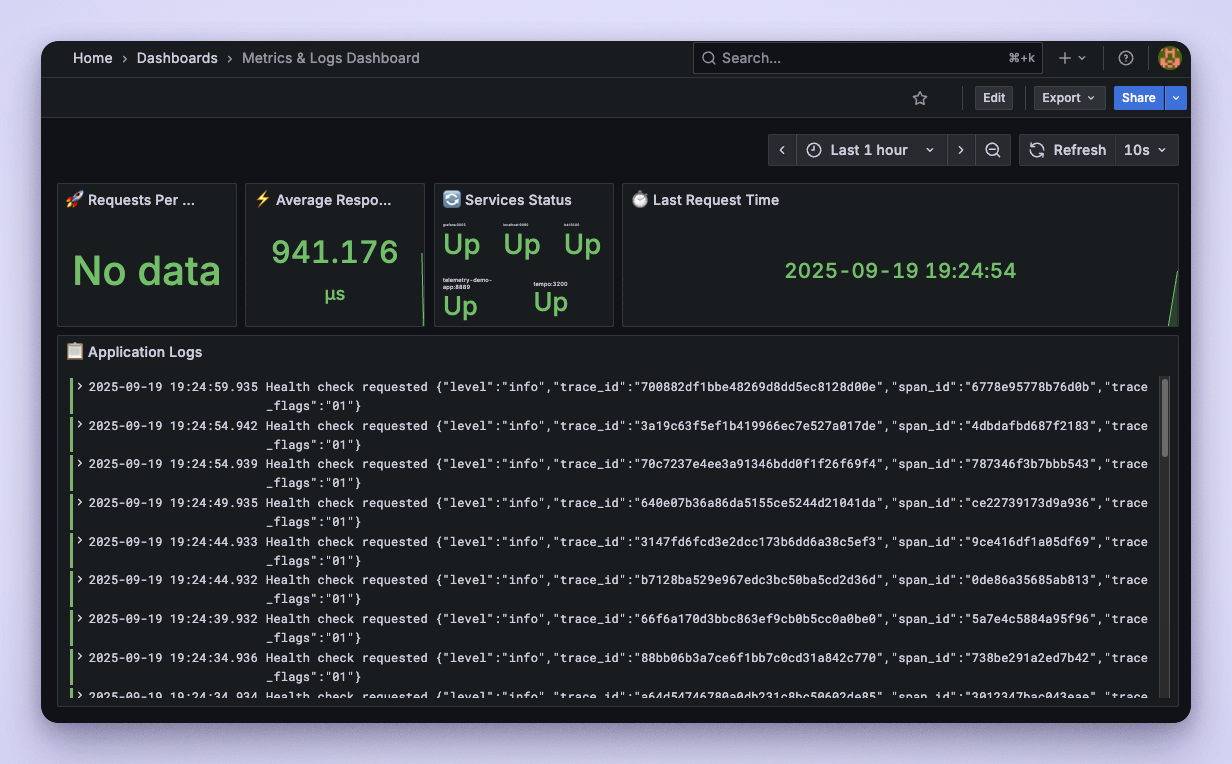
Grafana dashboard with missing data
In the next section, we’ll add new instrumentation that populates this panel, and you’ll see how mirrord helps us verify that the instrumented code is working as expected, without us having to commit any code or go through any CI/CD pipelines for deployment.
Using mirrord to Test Our OpenTelemetry Code
Open up src/app.ts and look for the commented-out lines of code. This is the code that completes the instrumentation of our app and fixes the Requests Per Second panel.
// const totalRequests = meter.createCounter('app_requests_total', {
//   description: 'Total application requests',
// });

// totalRequests.add(1);

// const span = tracer.startSpan('api_data_request');
// span.setAttribute('http.method', req.method);
// span.setAttribute('http.url', req.url);
// span.setAttribute('http.status_code', res.statusCode);
// span.end();
// logger.info({ message: 'Handling /api/data request' });
Uncomment them to enable:
- A Prometheus counter (
app_requests_total) - A trace span for the
/api/dataroute - A structured log entry
This is the classic scenario now: you’ve just written some new OpenTelemetry instrumentation code, and now you want to check if it actually works. Traditionally you’d have to commit this code, wait for CI/CD pipelines to build container images and deploy them to your staging cluster. Only then would you be able to test if the instrumented code works or not. And if it doesn’t, you repeat the cycle again. With mirrord, the idea isn’t to replace your CI/CD pipelines, but to move them out of the fast feedback loop. They become the final validation step, not the thing you depend on every time you want to test code changes.
Install the dependencies for the app by running npm install. Now to run it with mirrord and connect it to the app pod in the cluster run:
mirrord exec --target pod/telemetry-demo-app-617cf864bc-xfsqq npm run dev
Make sure to change the pod name to your actual pod name which you can find by running kubectl get pods.
When you do this, your local app now routes outgoing traffic through the target pod, so to other services and the observability stack, it looks like the traffic is coming from within the cluster. That’s why we can test our instrumentation changes instantly, without building Docker containers or deploying to Kubernetes. If you’re curious about the details, check out our docs for a deeper dive into the architecture.
With the app now running locally using mirrord, send a request:
curl http://localhost:3000/api/data
Here’s what happens after that:
- The
curlrequest hits the app, which is running locally on your machine. Normally, the local app wouldn’t know anything about the cluster or the observability stack, it would just handle the request and be done. - But because we’re running it with mirrord, outgoing traffic from the local process is routed to the cluster. So any requests our locally running instrumented code makes to the observability backend actually appear as if they’re coming from the target pod in the cluster.
- To the rest of the observability stack (Tempo, Loki, Prometheus, Grafana), it looks like the request originated from the pod inside Kubernetes, not from your laptop.
So when the local app emits:
- a metric (
app_requests_total), - a span (
api_data_request), - and a structured log message,
mirrord ensures all of those get picked up by the OpenTelemetry Collector sidecar running in the pod, which forwards them to the observability backend.
Now, go back to Grafana and refresh the dashboards. You should see:
- Requests Per Second panel lighting up with data from the
app_requests_totalmetric - Distributed Tracing dashboard showing the new
api_data_requestspan - Logs panel showing “Handling
/api/datarequest,” complete with trace IDs
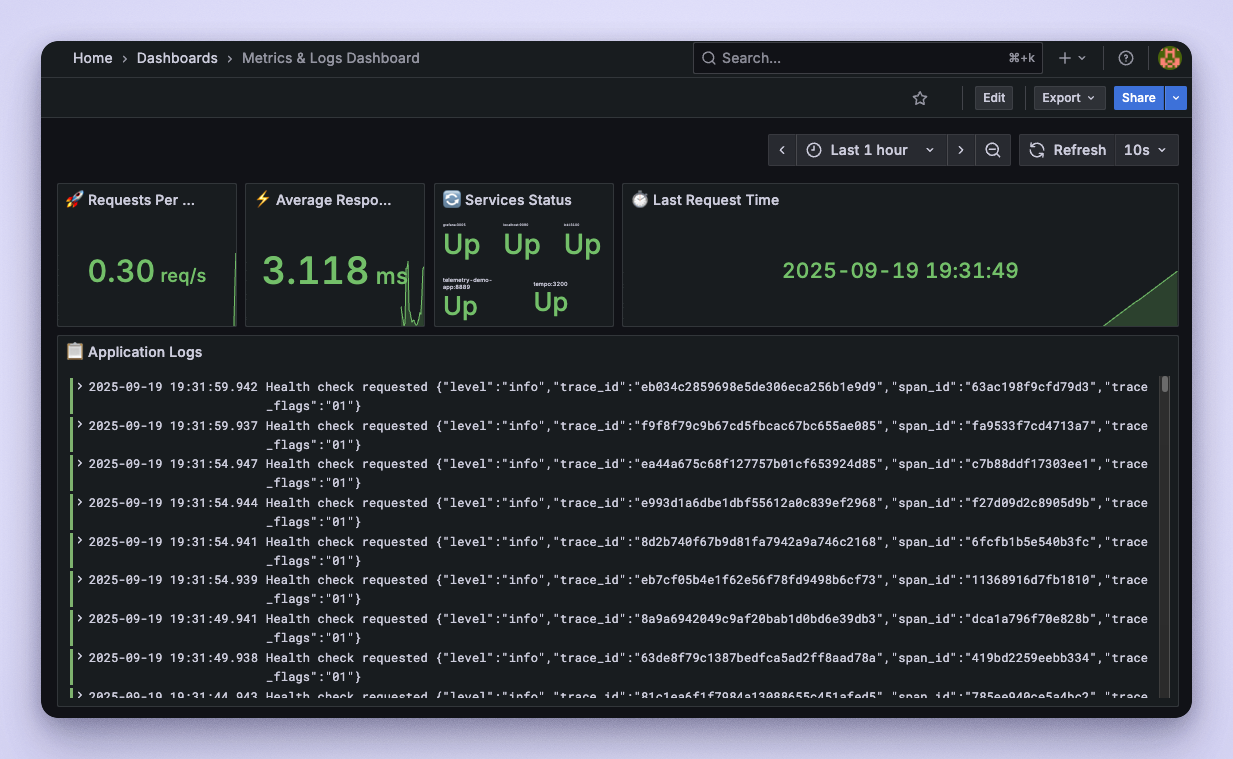
Fixed Grafana dashboard
Adding Observability to Your Cloud Applications Is Simpler with mirrord
Observability isn’t optional in cloud applications anymore. It’s the only way to understand what’s happening inside complex, distributed systems. But instrumenting your code to enable observability is rarely that simple. Things often don’t work on the first try, and developers spend multiple iterations trying to get it right.
mirrord fixes that. With mirrord, you get to:
- Run your app locally while it behaves like it’s already in your cluster
- Test new OpenTelemetry instrumentation instantly, without CI/CD or deployments
- See your metrics, logs, and traces land in Grafana (or any other observability platform you’re using) in real time
So the next time you’re adding observability to your cloud applications, remember that you don’t need to go through the tedious deploy-and-wait cycle multiple times. With mirrord, you can instrument faster, validate sooner, and spend more time actually building. If you want to try it out for yourself, check out mirrord on GitHub!